Raster charts
A raster chart is a chart made of pictures rather than features. Lookout reads two kinds:
- MBTiles. Satellite imagery, or another vendor's chart rendered to tiles. Cruisers publish these for coasts the ENC covers poorly.
- BSB/KAP. Raster nautical charts, such as the discontinued NOAA RNC sheets, baked with tile57.
The ENC gives you the depths, the aids and the hazards. It cannot show you what is there now: the coral heads, the sand bar across the entrance, the breakwater built since the last edition. A raster chart can.
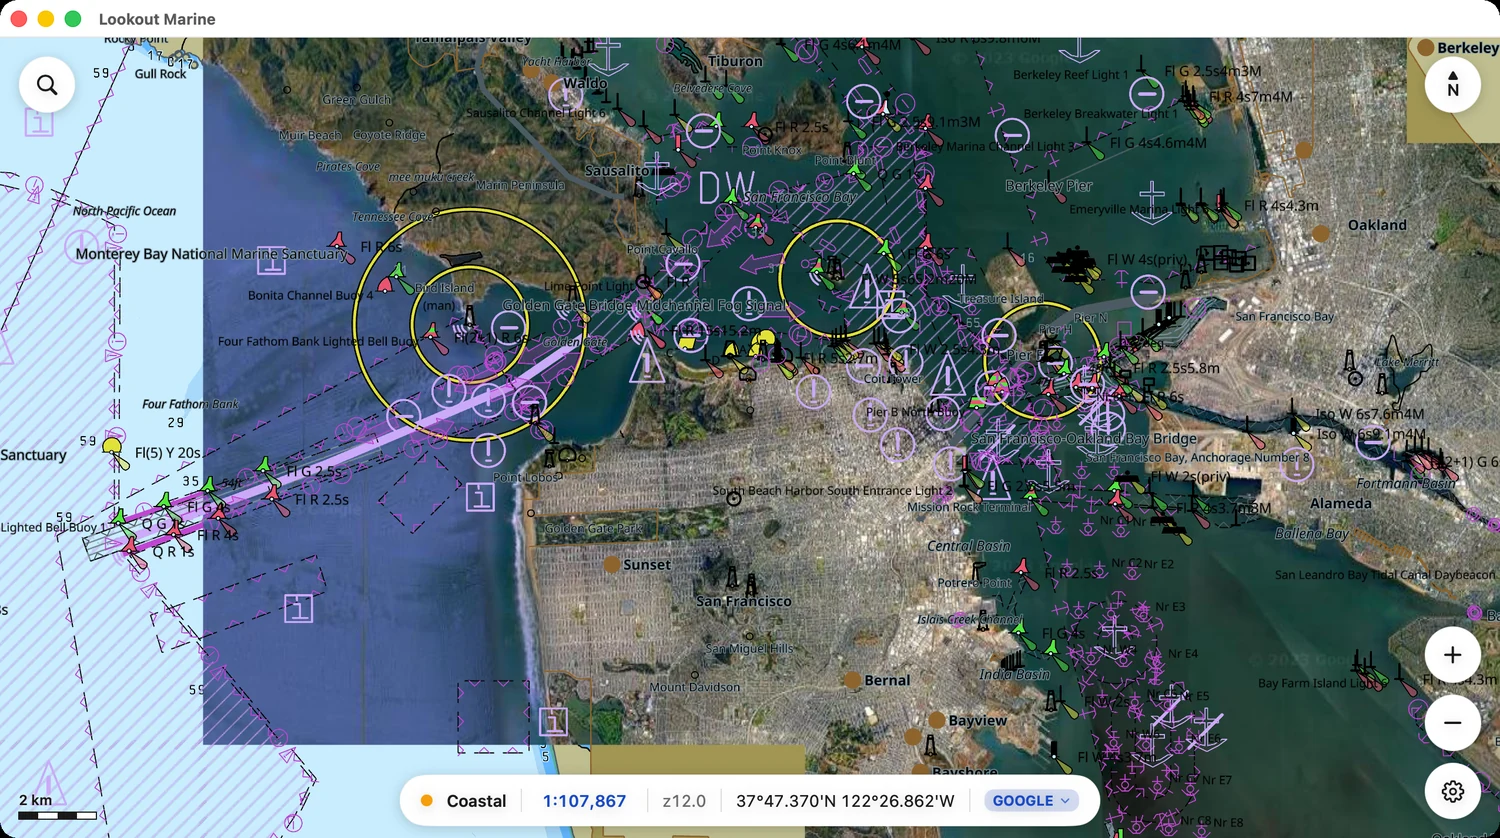
Lookout draws the raster chart below the ENC, and drops the ENC's own shading only where the raster chart covers. The ENC's features stay on the chart, and the picture underneath them is visible.
Viewing a raster chart under the ENC
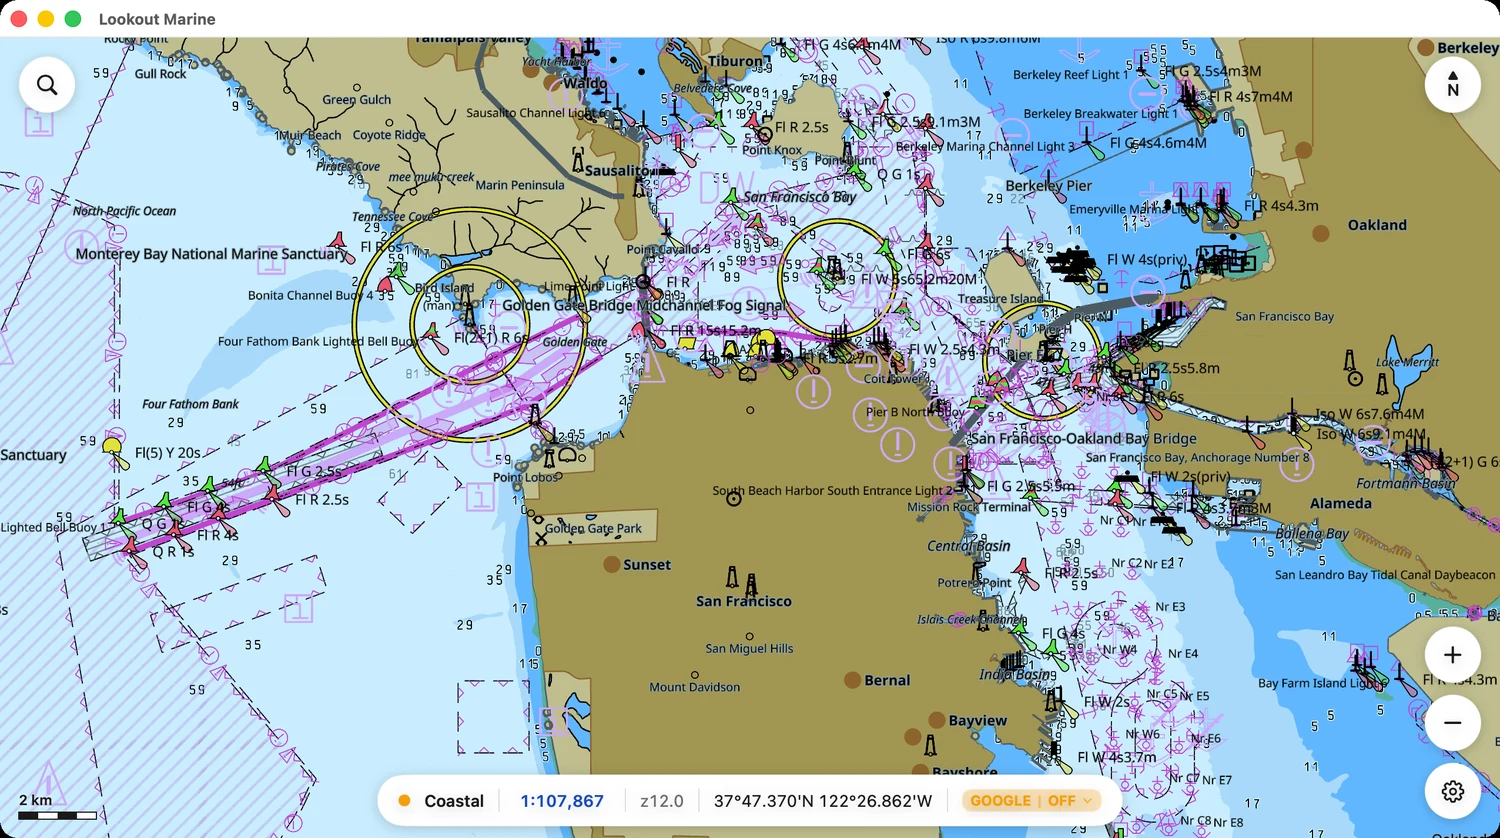
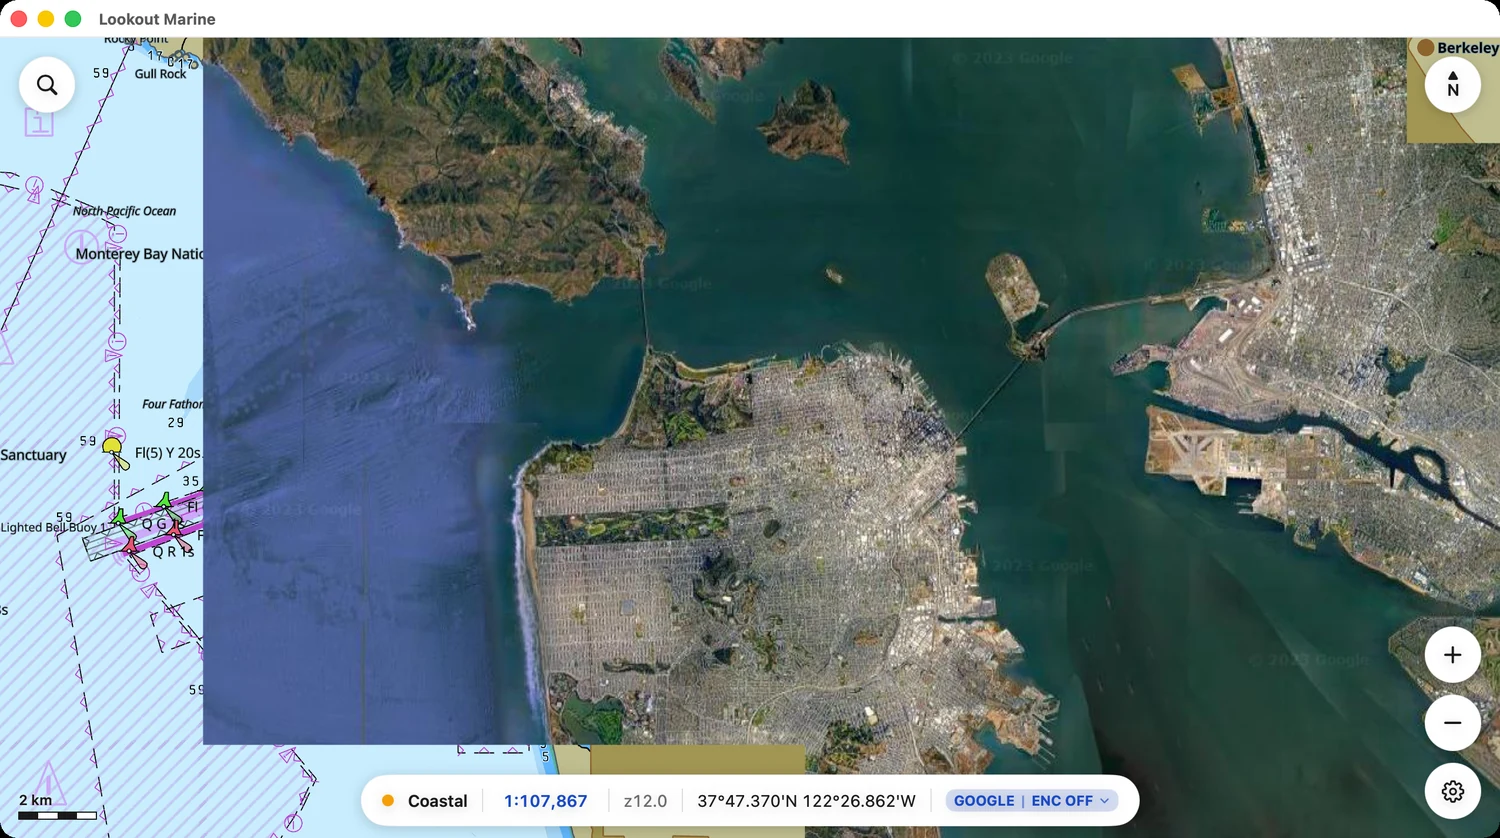
The Golden Gate, from the same position, in each of the three states.
The ENC on its own. Depths, aids and hazards. No picture of what is there.
A raster chart below the ENC. Where the raster chart covers, the ENC drops its depth and land fills and keeps everything else: the contours, the buoys, the lights, the traffic separation, the soundings and the labels.
The raster chart with the ENC hidden. ⇧⌘H hides the ENC wherever the raster chart covers. Everywhere else the ENC still draws.
Adding a raster chart
Open Chart ▸ Add Raster Charts… (⇧⌘I), or the Raster charts section of the Charts tab in Settings. The panel takes several files at once, and whole folders.
Lookout installs the list again with every chart you open, so a raster chart survives both a change of ENC and a restart.
The Raster charts section of the Charts tab in Settings switches one off without removing it. These are half-gigabyte downloads, and carrying four providers for one coast usually means wanting three of them quiet.
What a set is
Files group into sets by their provider. Files named …ArcGIS…, …Bing…
and …Google… make three sets. Files from one provider covering adjacent
regions make one set and draw as a single continuous picture.
Compare the providers. Each shows a different day, a different tide and a different amount of cloud, and one of them shows the bottom.
Carrying sets for different coasts
Sets that cover different water are drawn at the same time. Carry a San Francisco set and an Atlantic set and each draws over its own coast. You do not have to switch sets when you change coasts.
⌘I steps only between sets that cover the water in view. Off San Francisco it steps between the sets that cover San Francisco. The Atlantic set is not one of the steps, and it stays drawn while you compare the others.
Each set keeps its own on and off. Turning the Atlantic set on does not turn a Pacific set on, and turning a Pacific set on does not turn the Atlantic set off. Turning one on turns off the sets that cover the same water, because only one picture can be drawn over a piece of water at a time.
⌘I past the last set turns off the sets covering the water in view. The sets covering other water stay as you left them.
When you are zoomed out far enough to see two coasts at once, ⌘I works on the one under the middle of the screen. If neither is under the middle, it works on the one filling most of the screen. The other coast is not changed. Centre the coast you want to work on, or zoom in to it.
Toggling raster charts
The pill sits at the right of the readouts. It appears whenever a raster chart is in view, at any zoom, and it goes when you leave the coverage. If you have added no raster charts, it never appears.
Sail into coverage with the raster chart switched off and the pill turns amber. It names the set and says that it is off:

Click the pill to open the list of every set that covers this view. The list marks the one being drawn, followed by None, the ENC switch and Add Raster Charts…
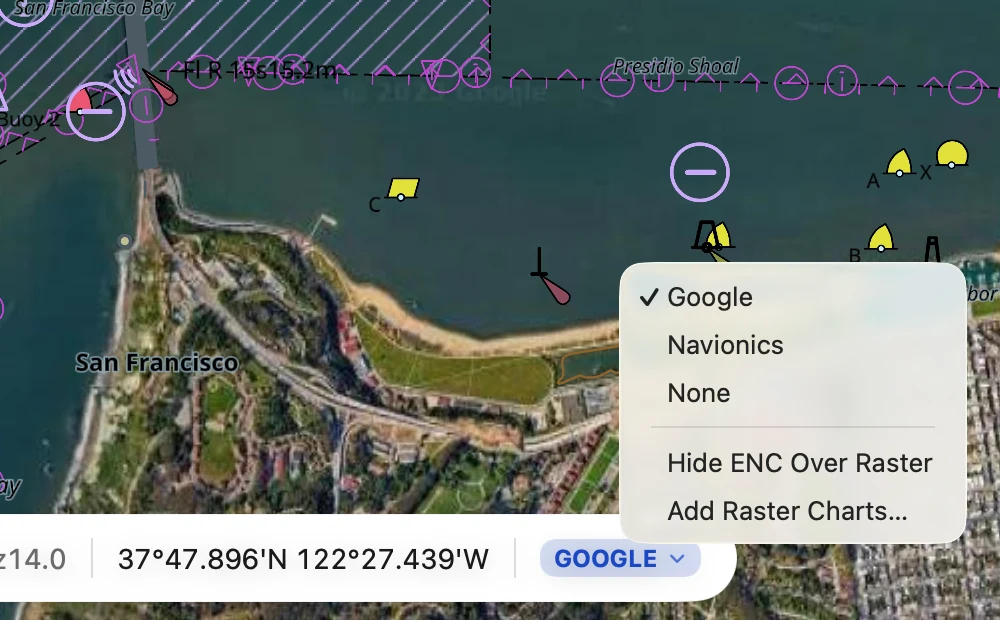
Choose a set and the pill turns blue:

With the ENC hidden (⇧⌘H) the pill stays blue, because the raster chart is still drawn, and the text says which one is off:

Three ways to the same thing:
| The pill | Click it for the list. |
| ⌘I | Step to the next set covering this water, then to none, then round again. |
| Chart ▸ Raster Chart | The same list, and Next Raster Chart for the step. |
⌘I opens no list, so you can keep your eyes on one spot on the chart while the imagery changes under it.
Leaving the raster chart's coverage
A raster chart changes the ENC only where it covers. Outside its bounds the ENC is untouched.
Below is the southern edge of a San Francisco Bay set, off Santa Cruz. Inside the rectangle you see the picture. Outside it you see the whole ENC: depth contours, soundings, buoys and the shading of the water.
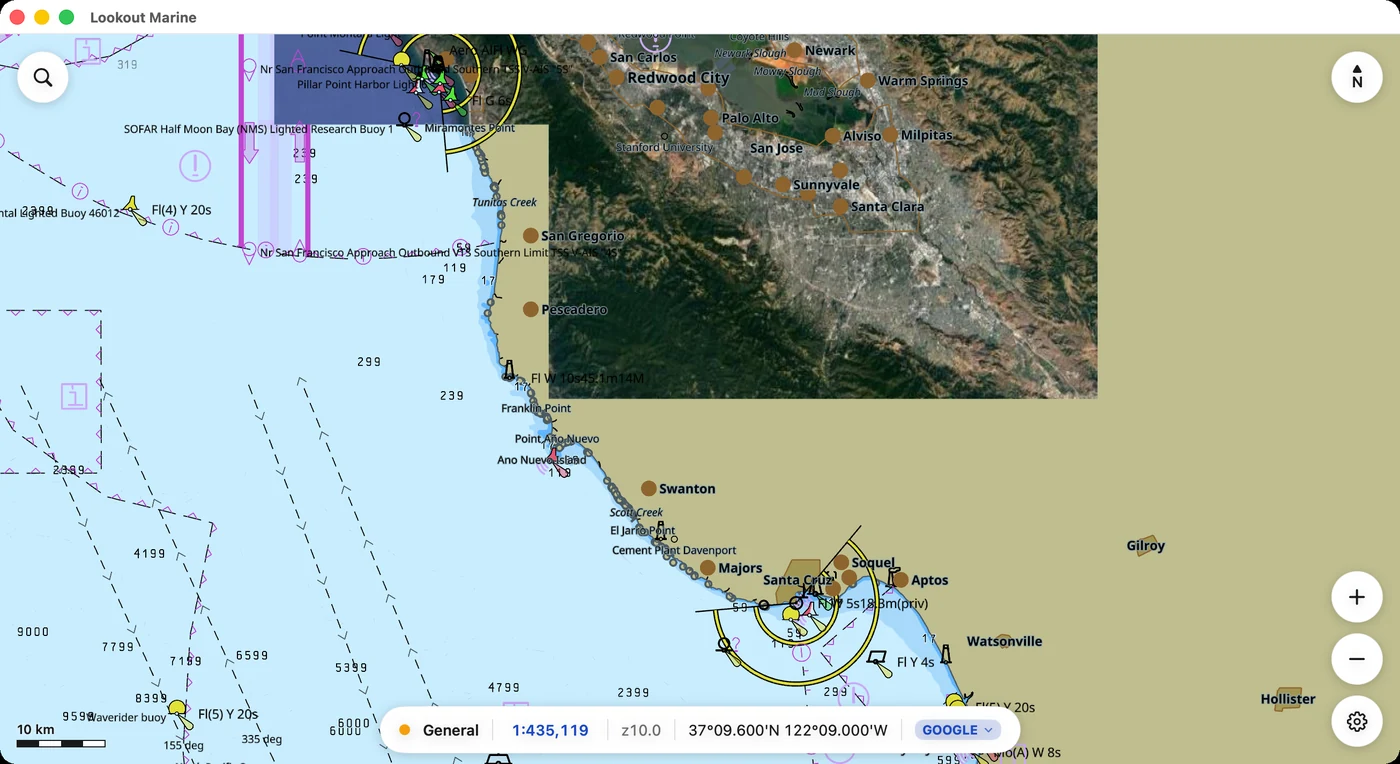
Holes behave the same way. These tile pyramids follow a coastline, so about a third of the ground inside their own bounds has no tile. The ENC draws there on its own, with no marker and no gap.
Comparing the raster chart with the ENC
Chart ▸ Hide ENC Over Raster (⇧⌘H), or the pill's list, hides the ENC wherever the raster chart covers. The ENC stays everywhere else.
Use it to check that the two agree. Hide the ENC and show it again over a jetty or a buoy: anything that jumps is a real disagreement between them. Your eye finds that movement far more easily than it finds a small offset in a blend.