Getting Started
This guide walks you through the app. You do the work in the browser — the server downloads and bakes charts for you. It takes a few minutes.
Step 1: Start the app
The web frontend is built into the binary, so you need no other files. Start the server:
chartplotter serve
Open http://127.0.0.1:8080 in your browser. You see an empty map and a toolbar.
Step 2: Add charts
Open the Chart Library, pick a source, and choose a region. The server downloads the cells and bakes them into tiles in the background.
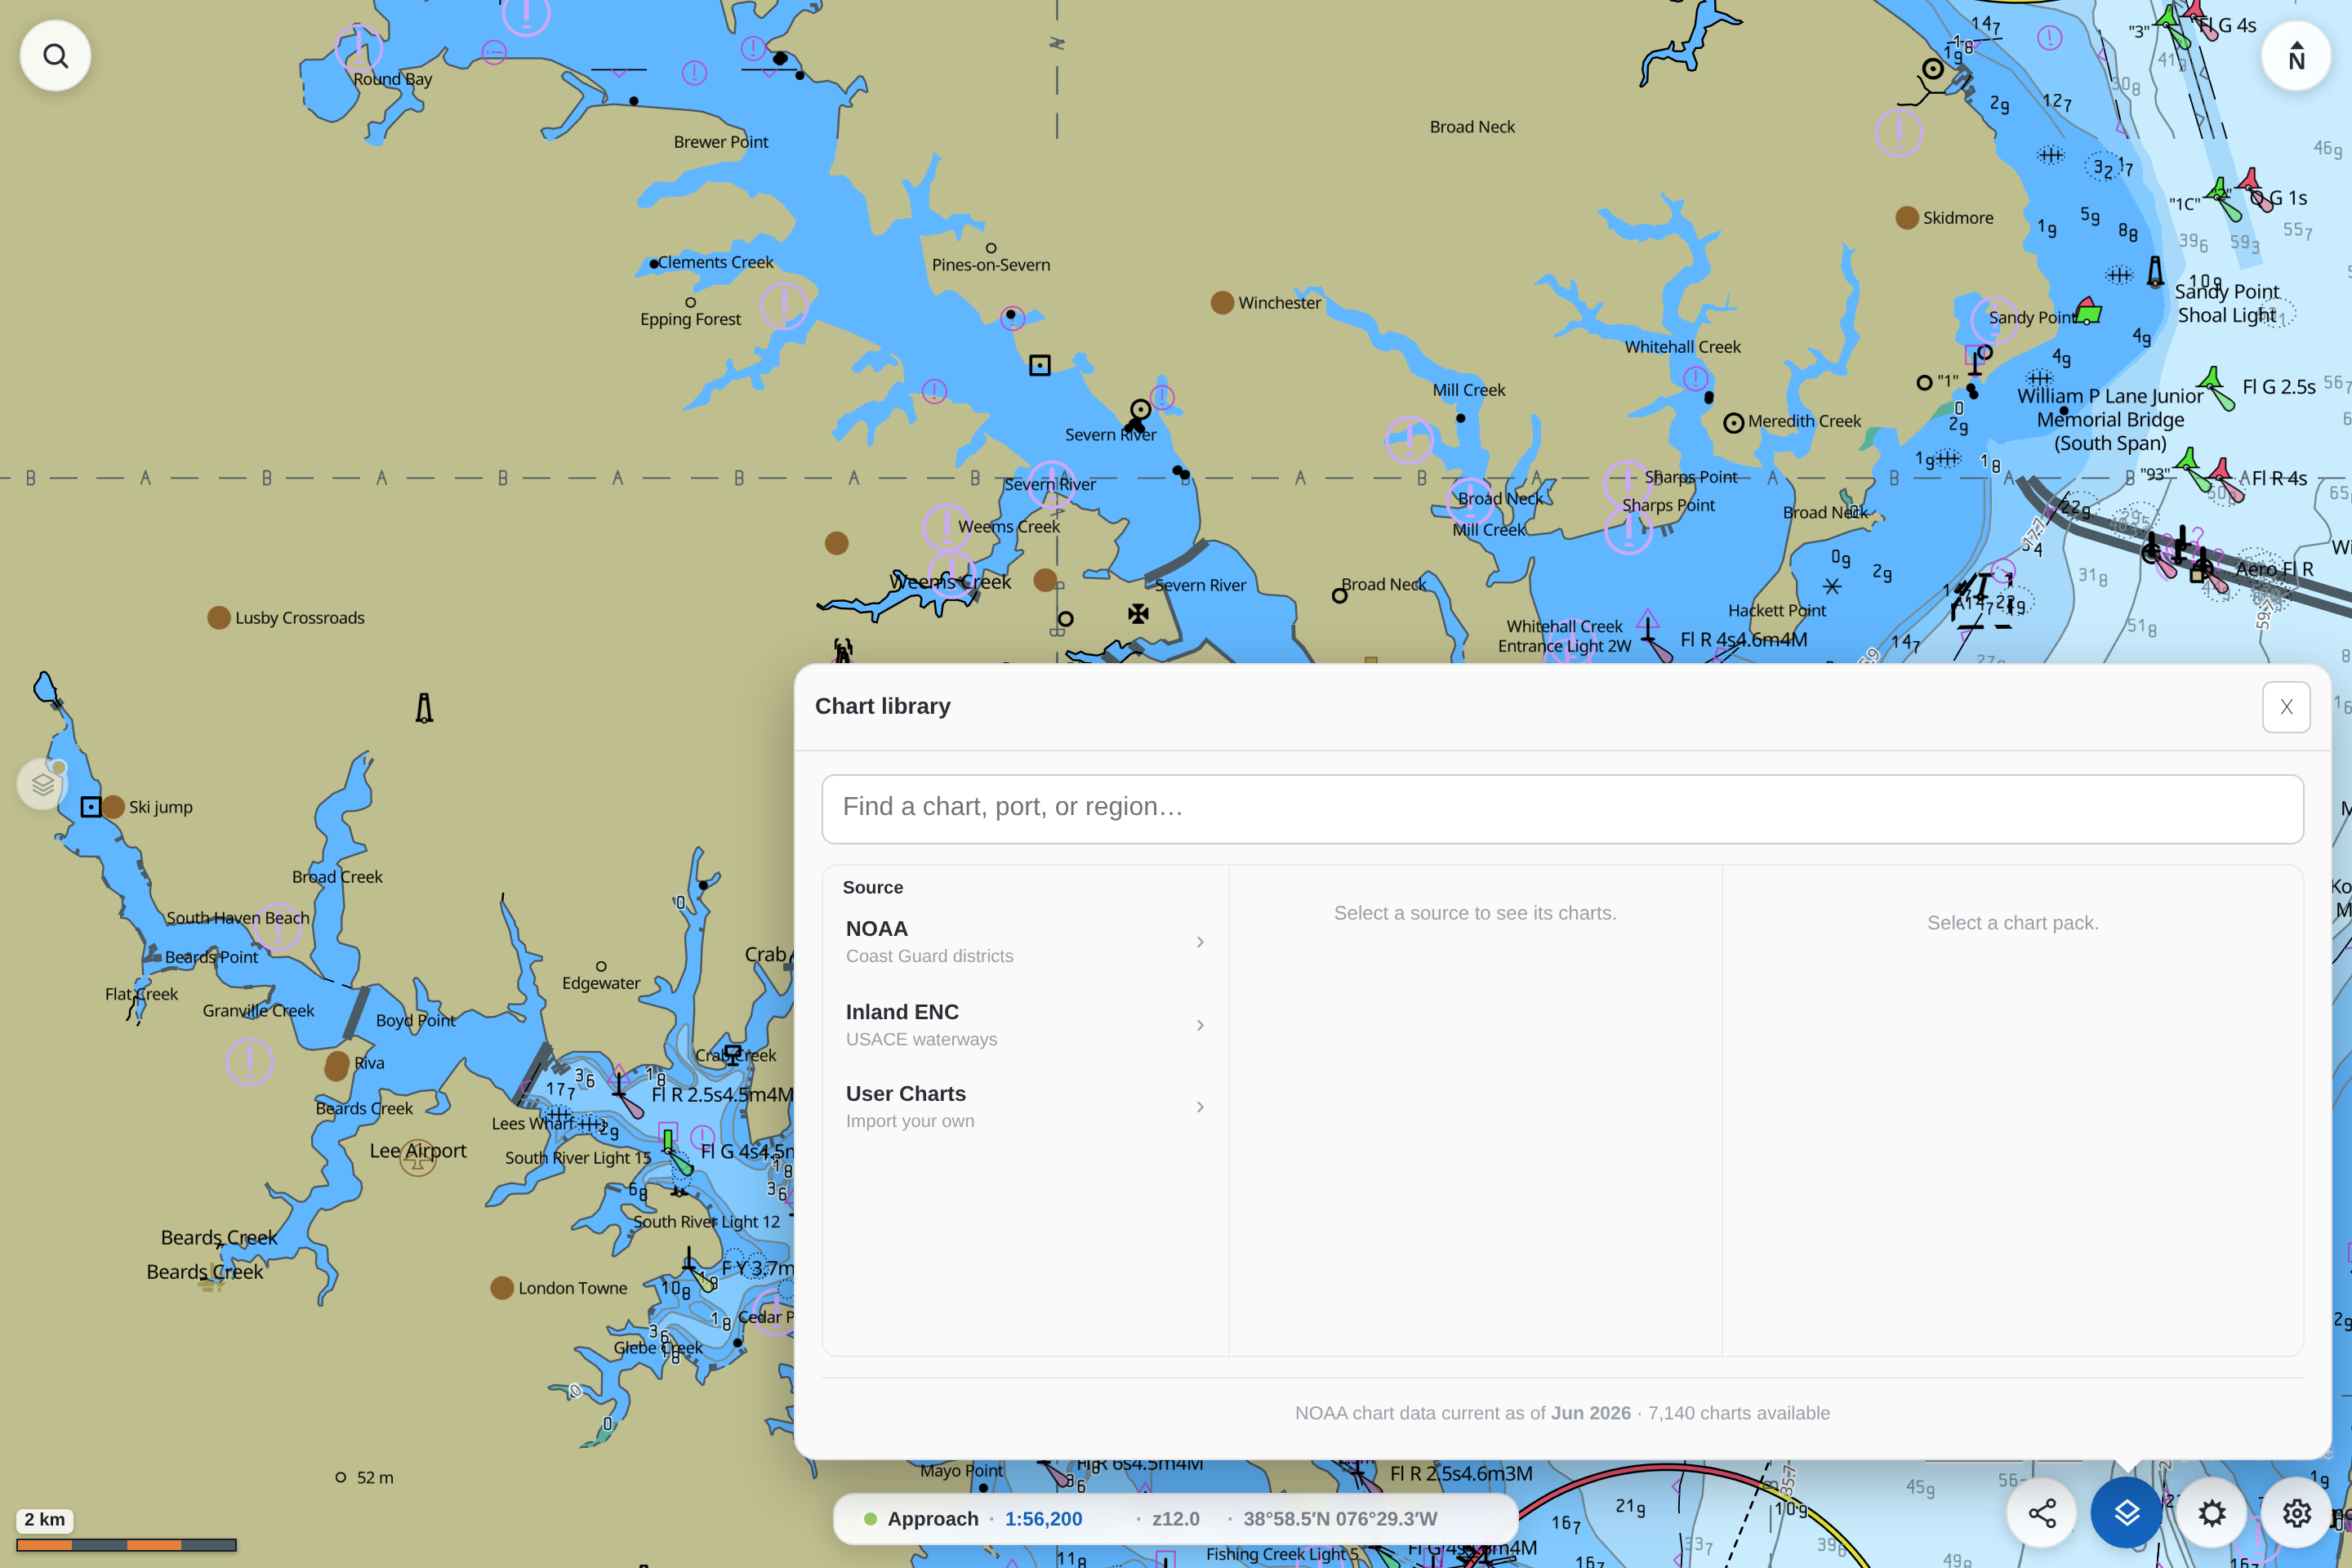
- NOAA — official U.S. charts, grouped by Coast Guard district.
- Inland ENC — USACE inland waterway charts.
- User Charts — import your own S-57 cells or a NOAA ENC zip.
When the bake finishes, the chart appears on the map. Baking is the memory-intensive step and can use several gigabytes of RAM for a large region; on a small machine, add one region at a time. See Memory and disk.
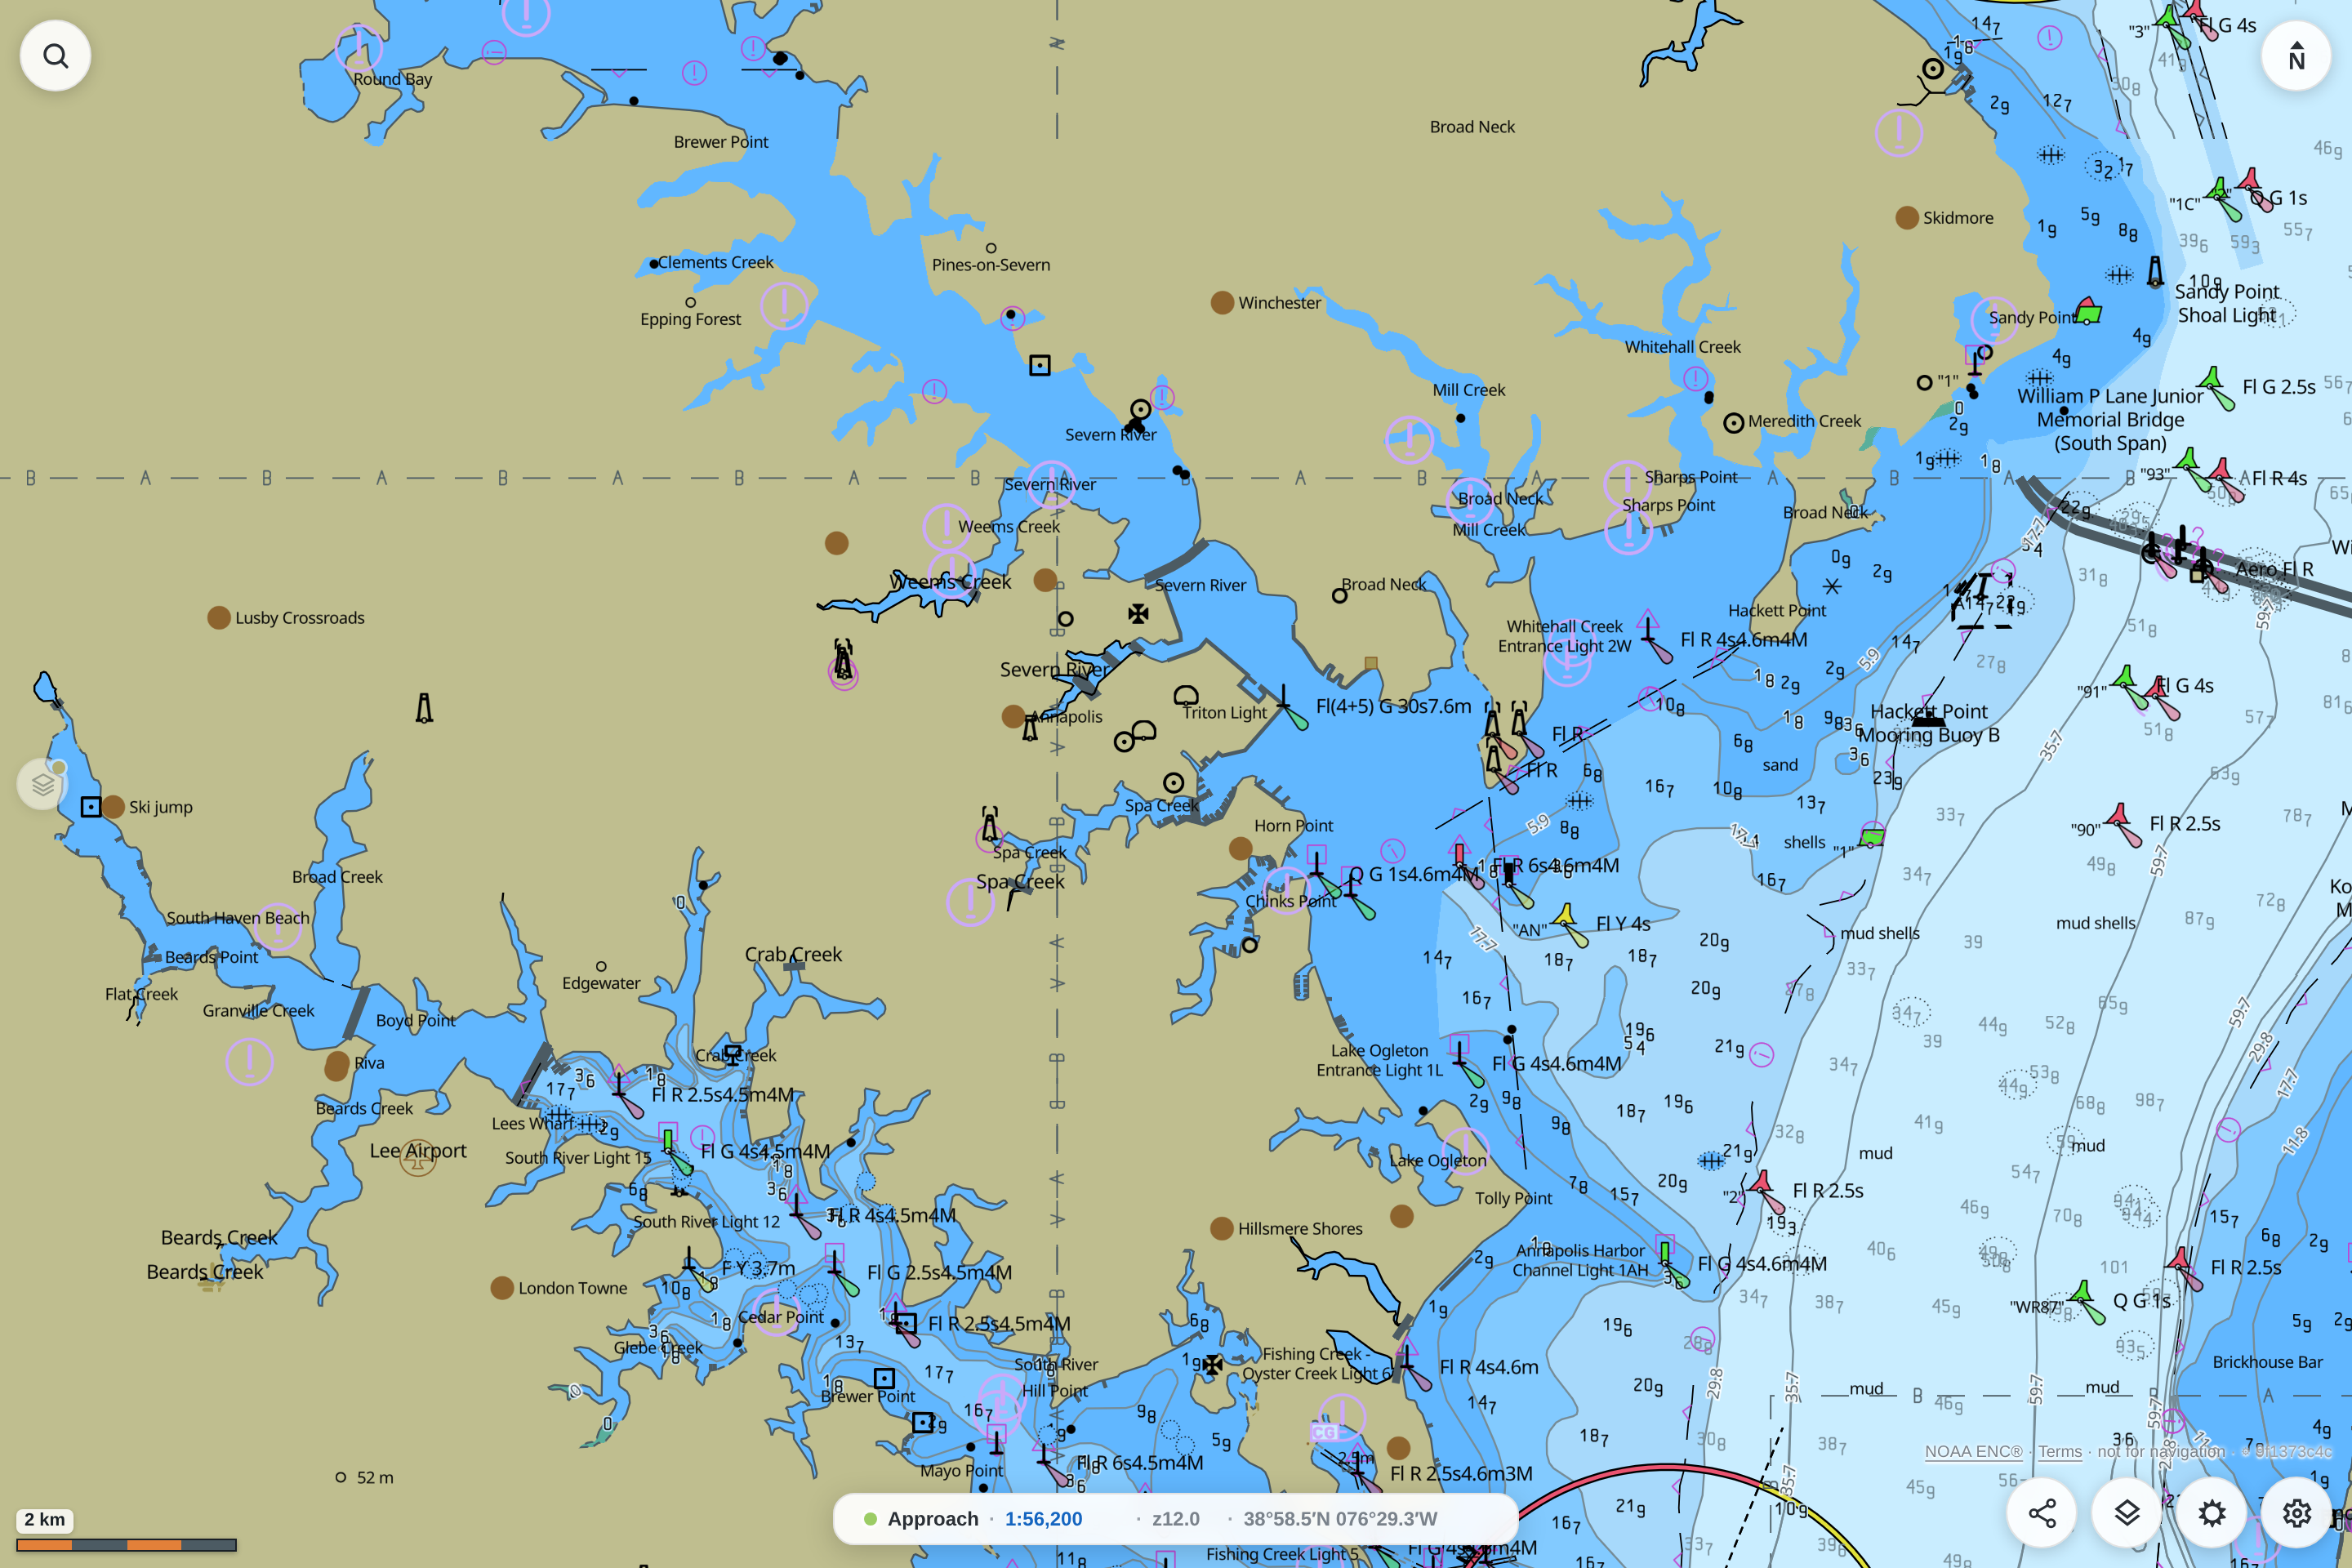
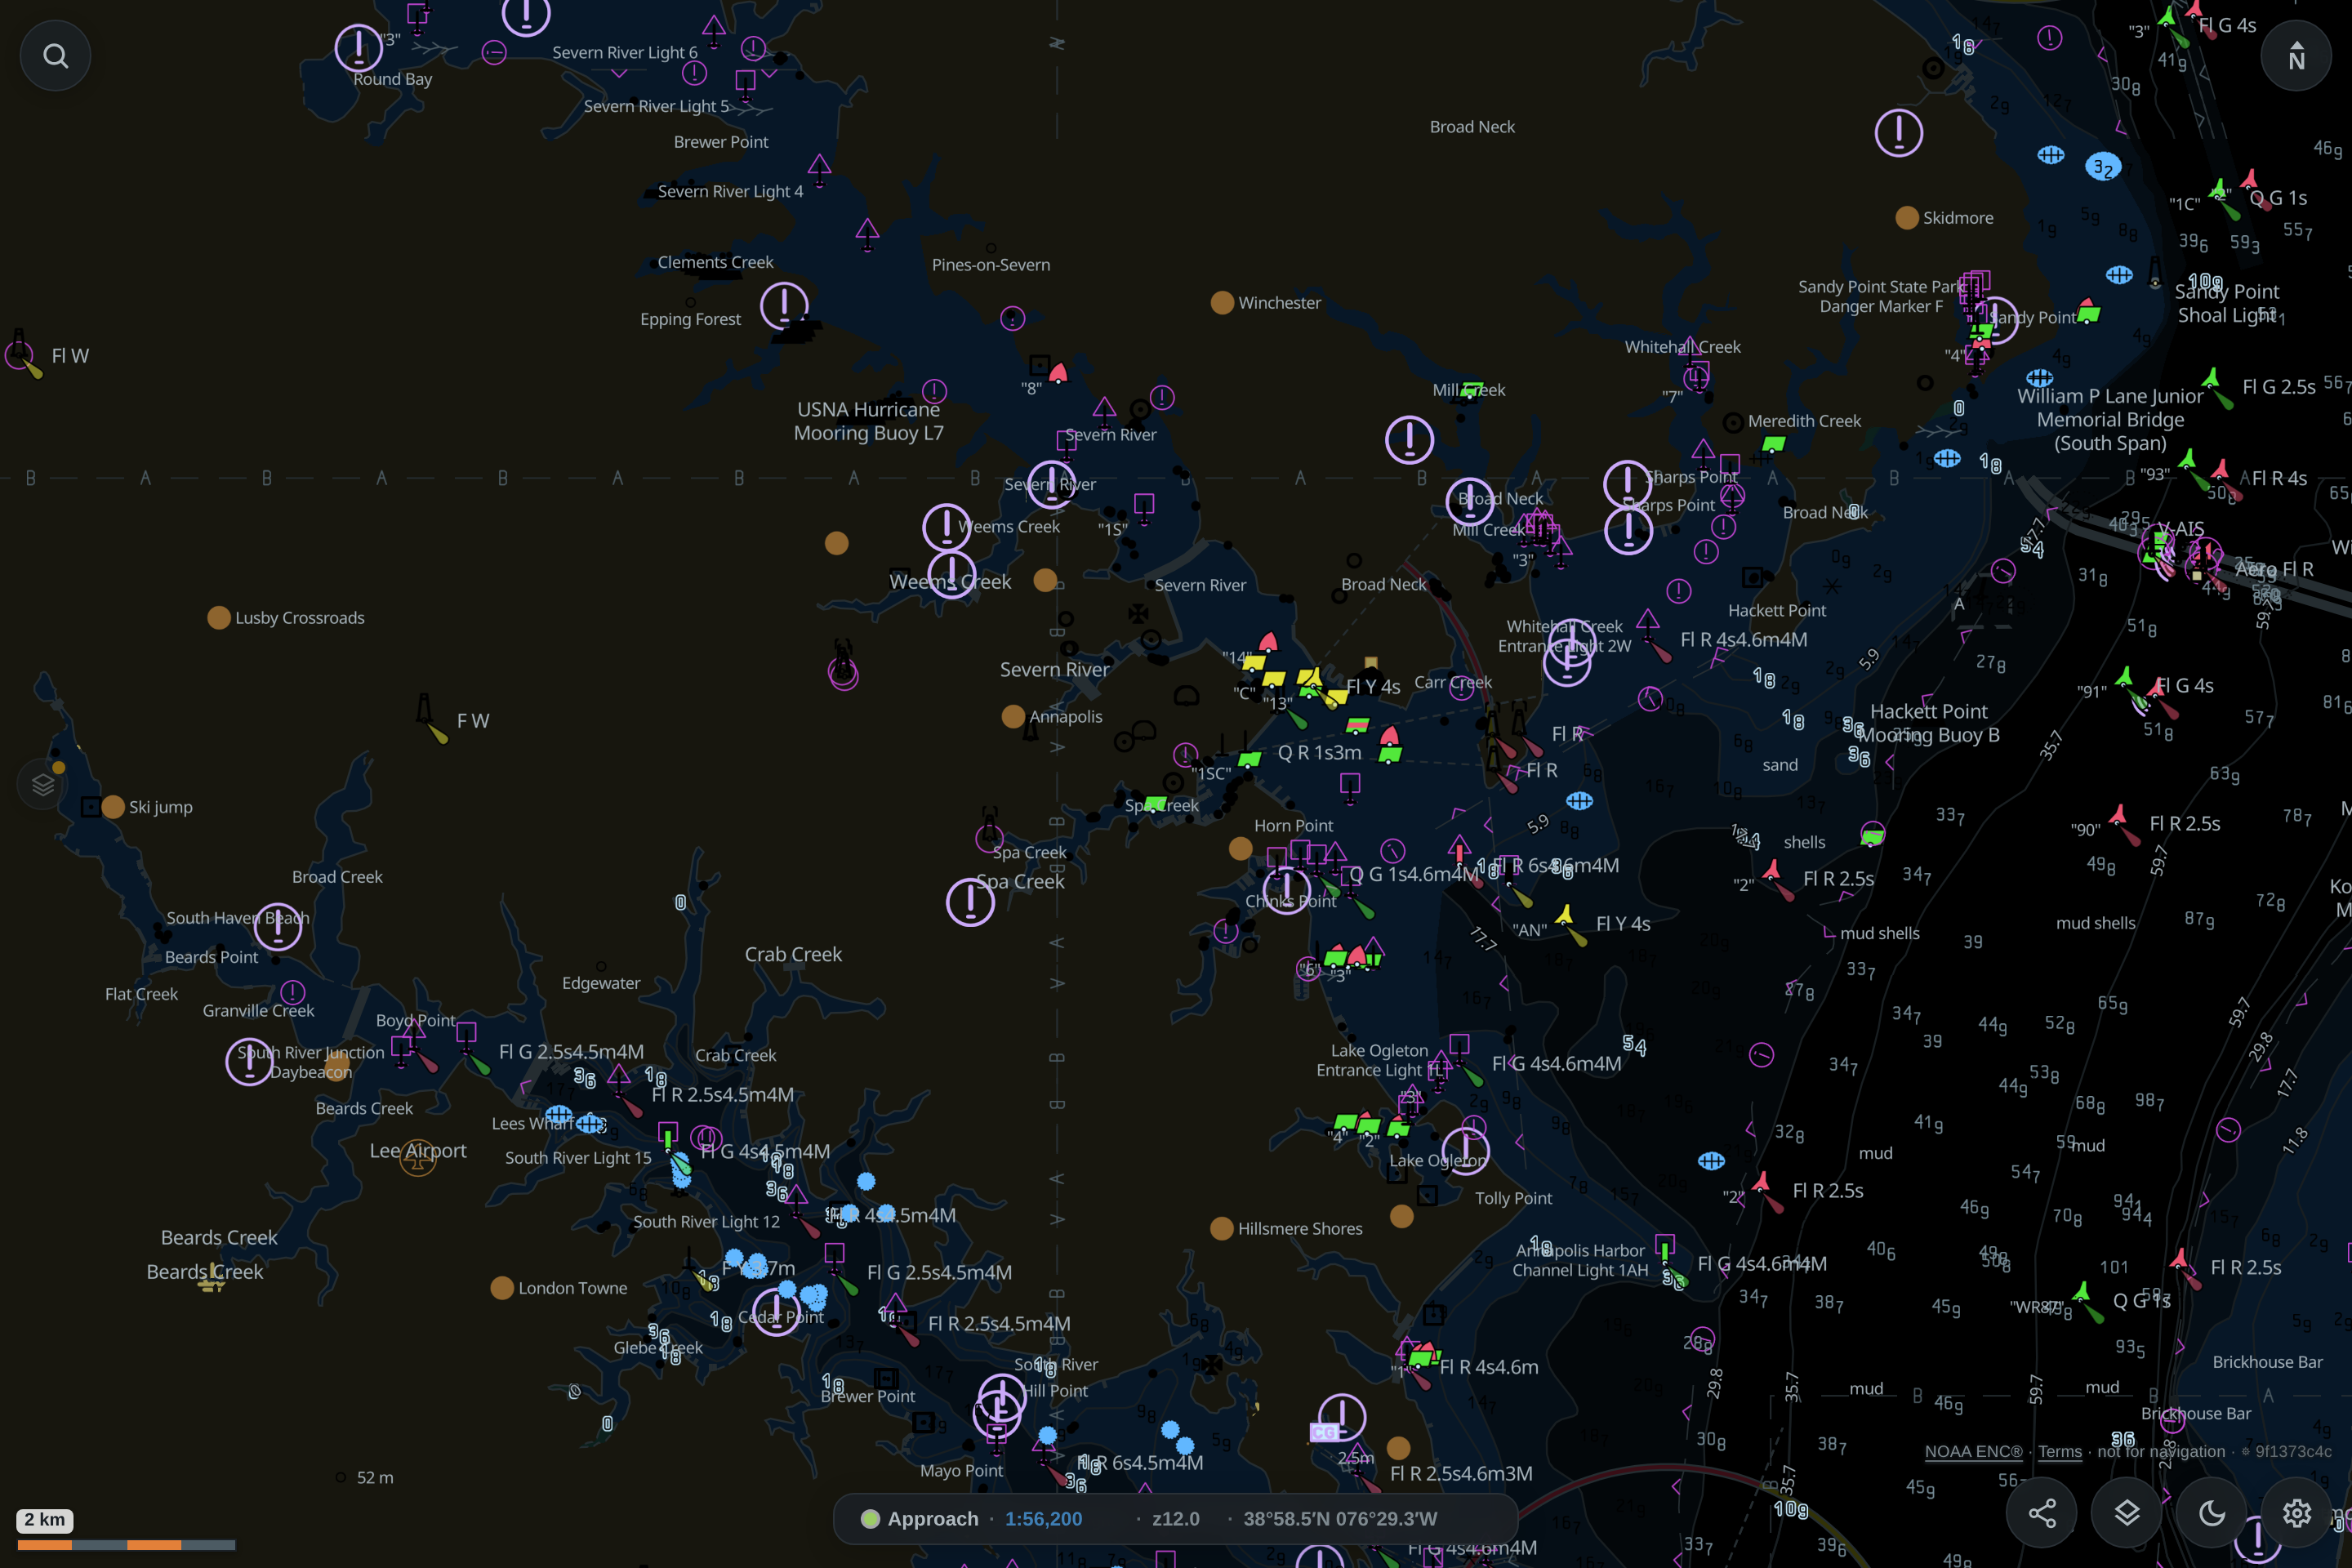
Step 3: Switch Day, Dusk, and Night
Tap the color-scheme button to cycle Day → Dusk → Night. The map restyles at once, because the engine stores color names and resolves the palette in the browser. You never rebake to change the lighting mode.
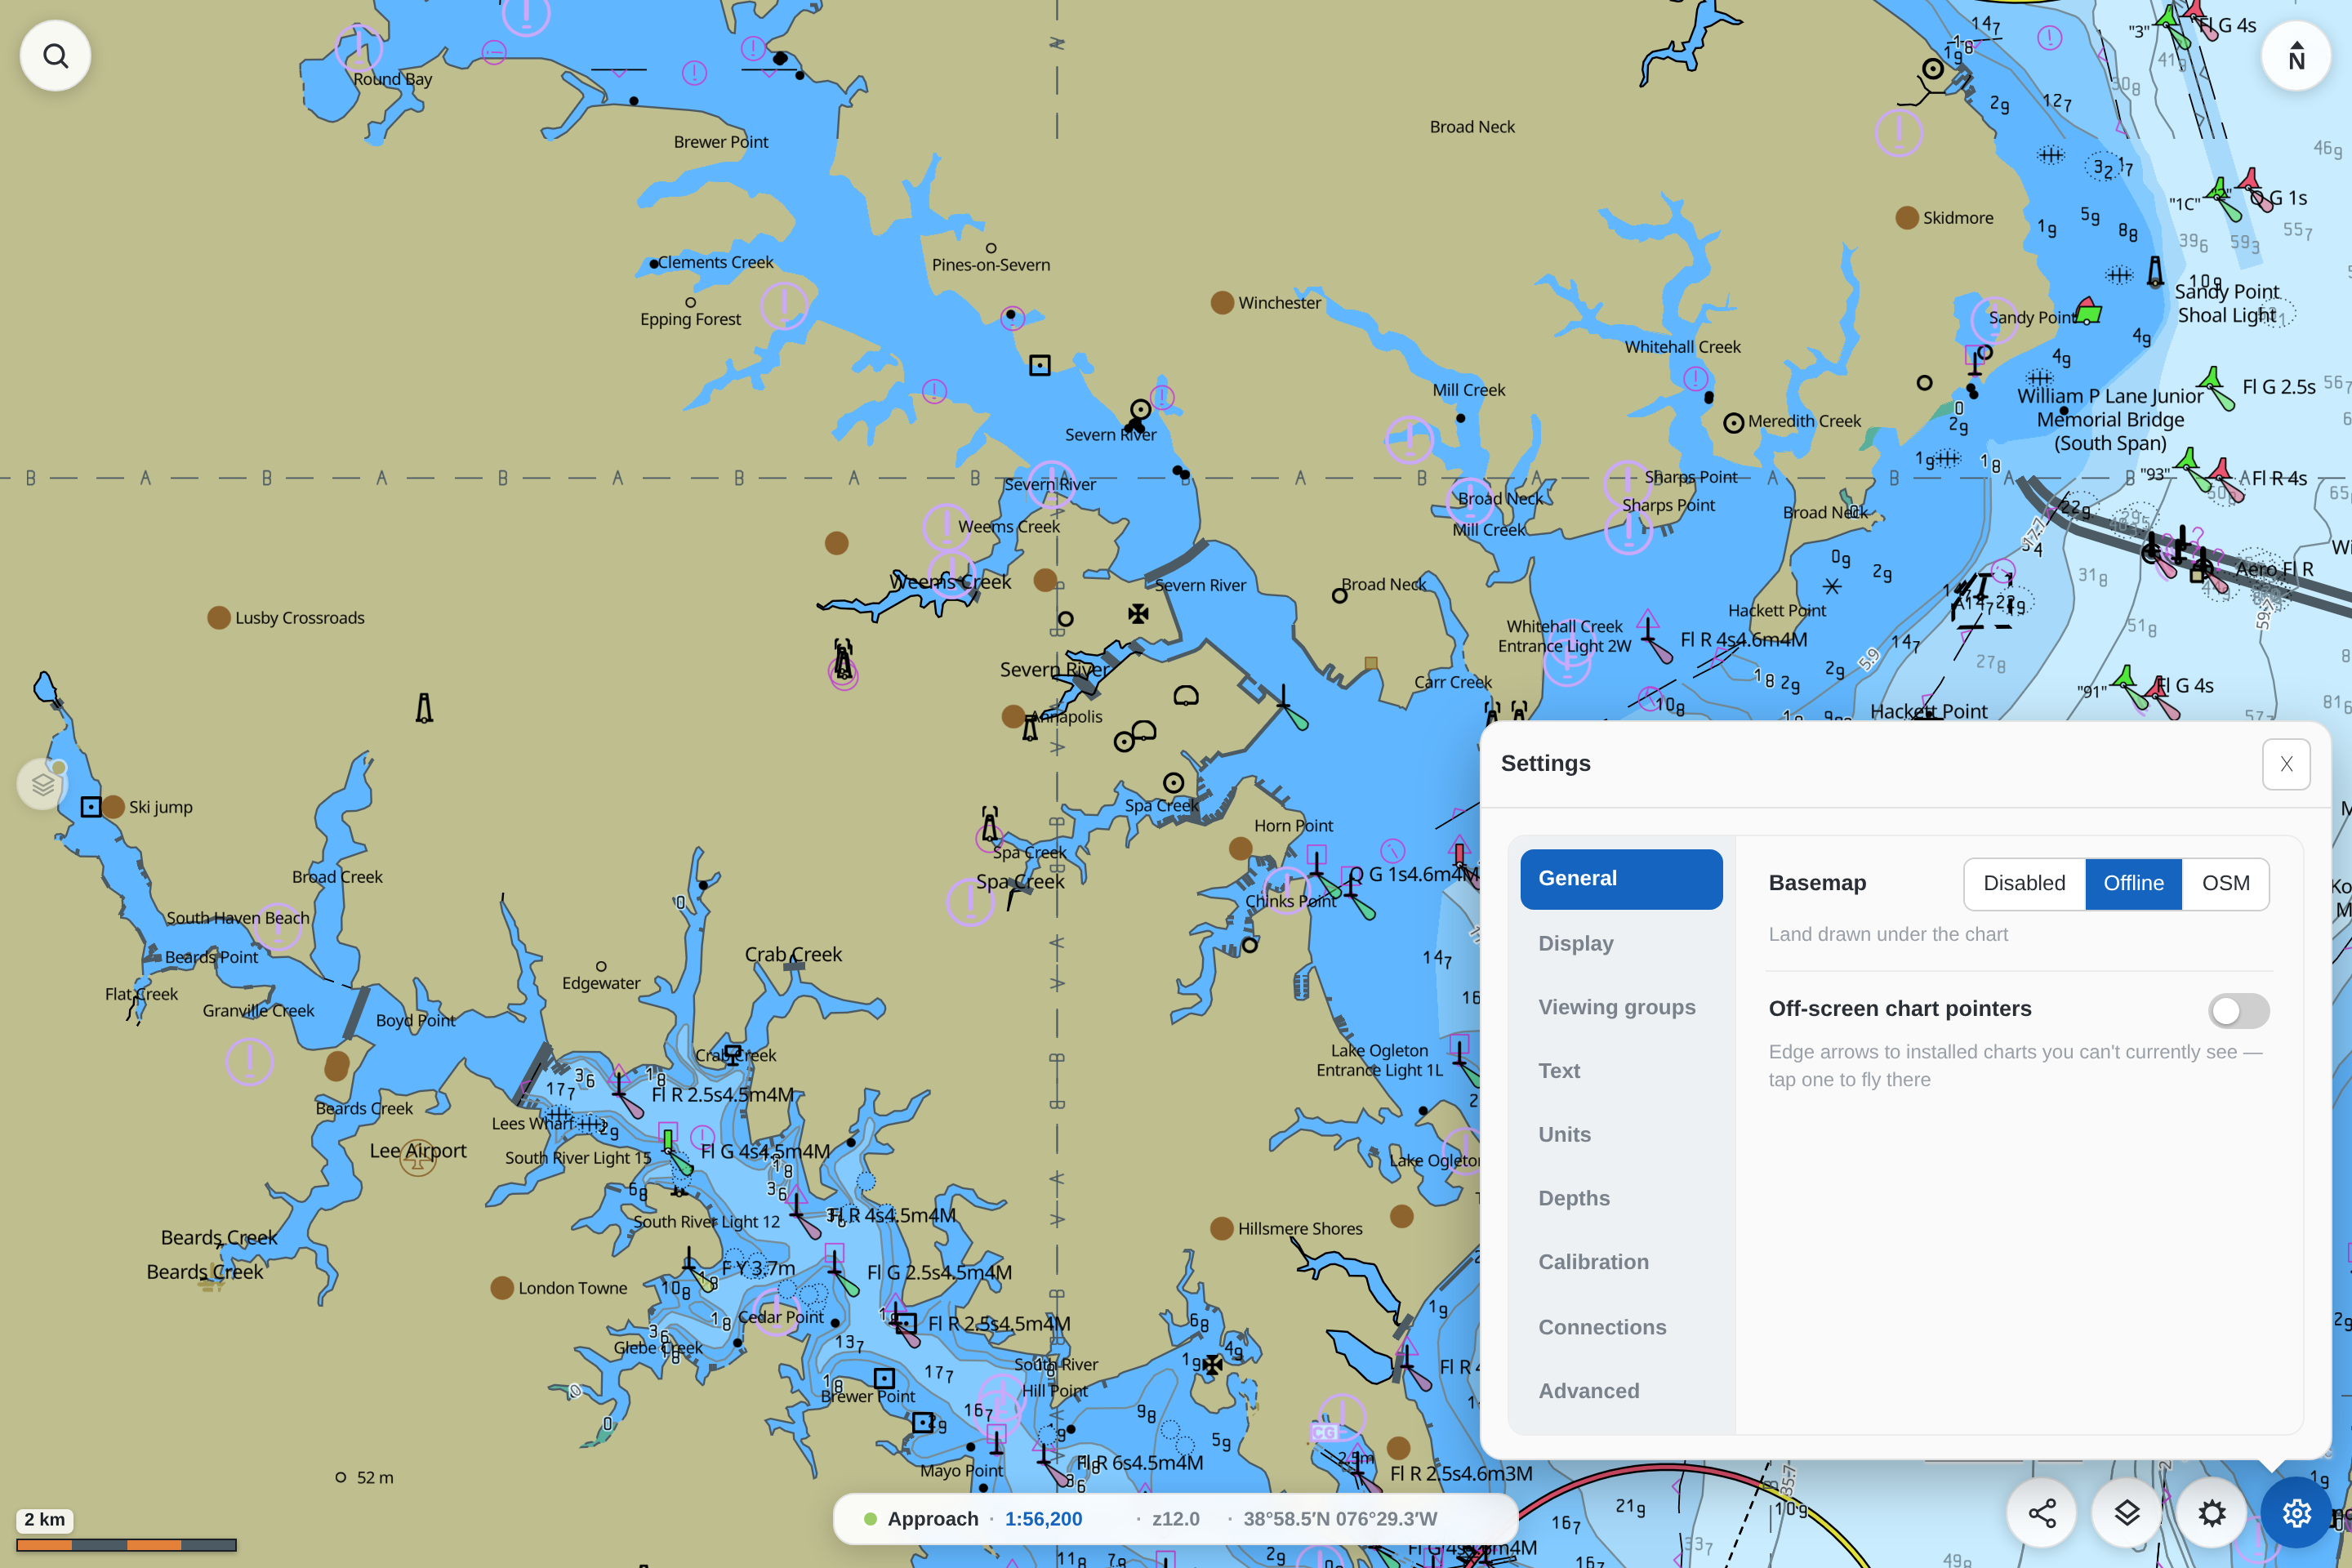
Step 4: Adjust the display
Open Settings to control what the chart shows: the basemap, the level of detail, depth shading, soundings, contours, and more. These settings apply live — the viewer reads attributes already baked into the tiles, so there is nothing to rebake.
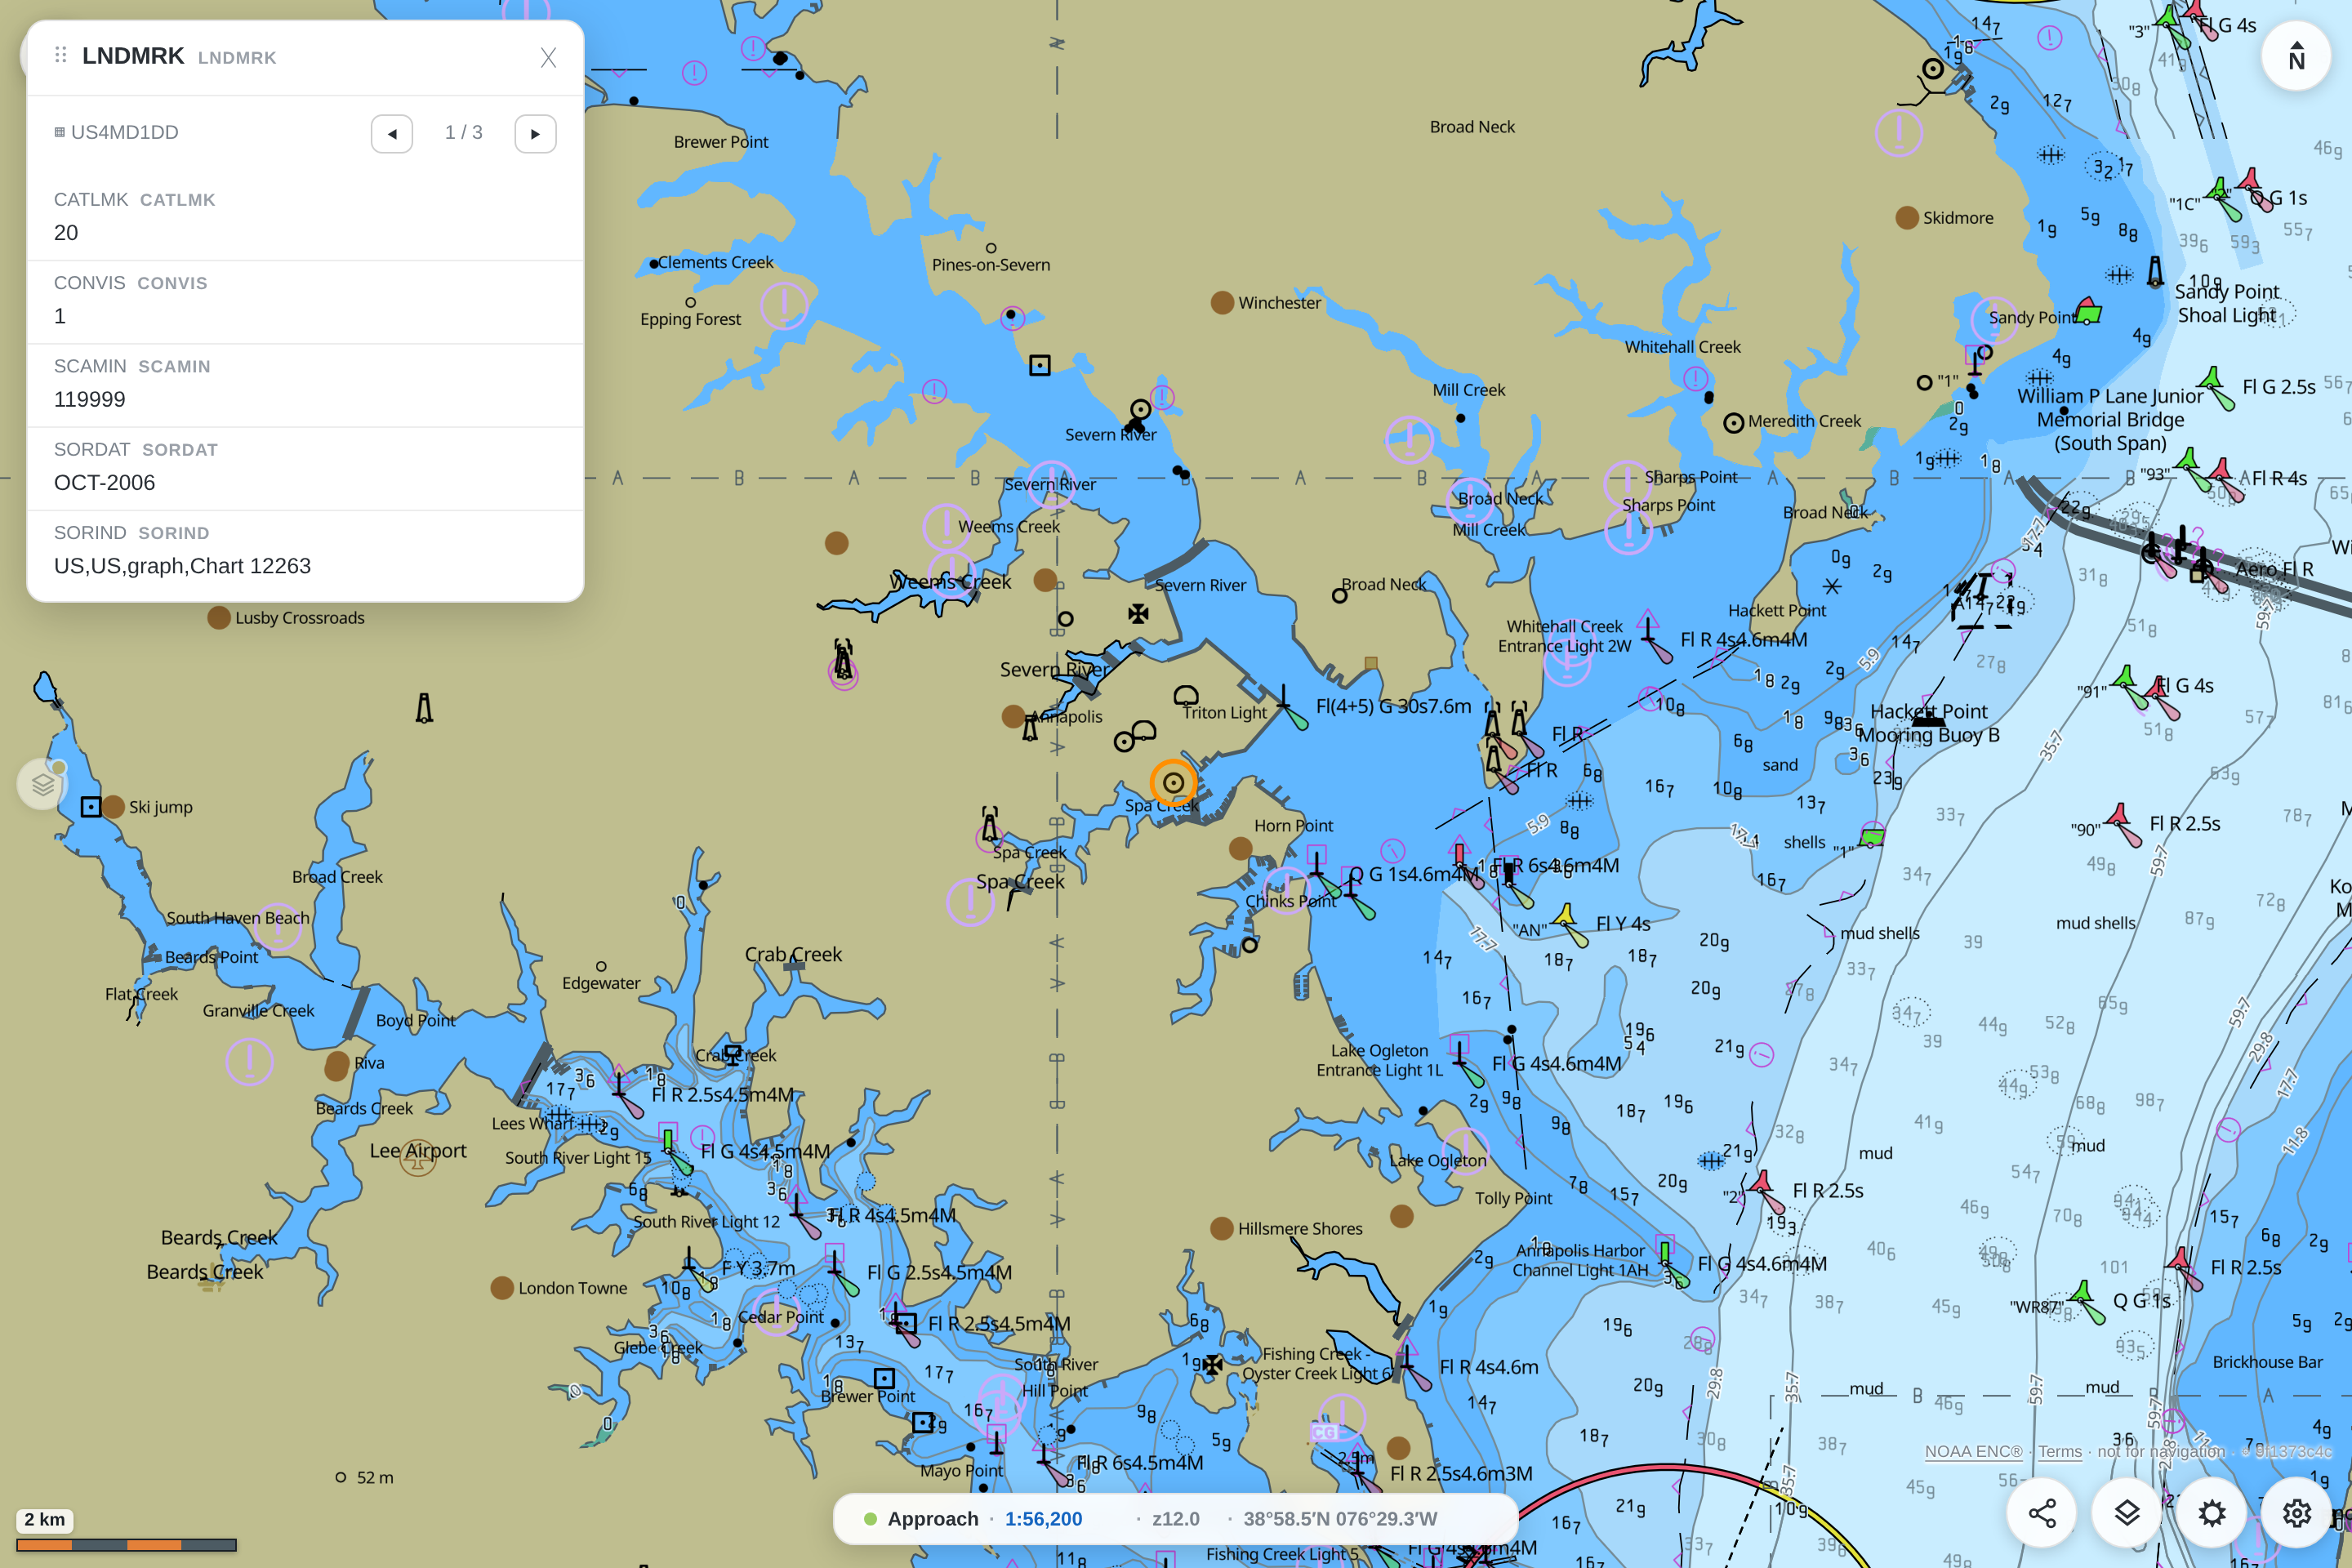
Step 5: Inspect a feature
Tap any feature to open the pick report. It lists the feature's attributes — restrictions, light characteristics, depths, source dates, and any attached text.
Where to go next
- Put a chart on your own page — see Widget mode for the read-only, no-server build and how to package and deploy it.
- Learn how a cell becomes tiles in Architecture.
- See the exact tile layers and fields in the Tile Schema.
- Look up the commands in the CLI Reference if you want to bake archives from a script.